

Reports that writethemselves.
the month, the story under your brand and it to your client's inbox.
Three altitudes of answer.
Different questions deserve different views — all fed by the same live connections.
Live dashboards
Campaign Performance drills from campaign to ad set and asset group — Google and Meta side by side, with period deltas on every metric.
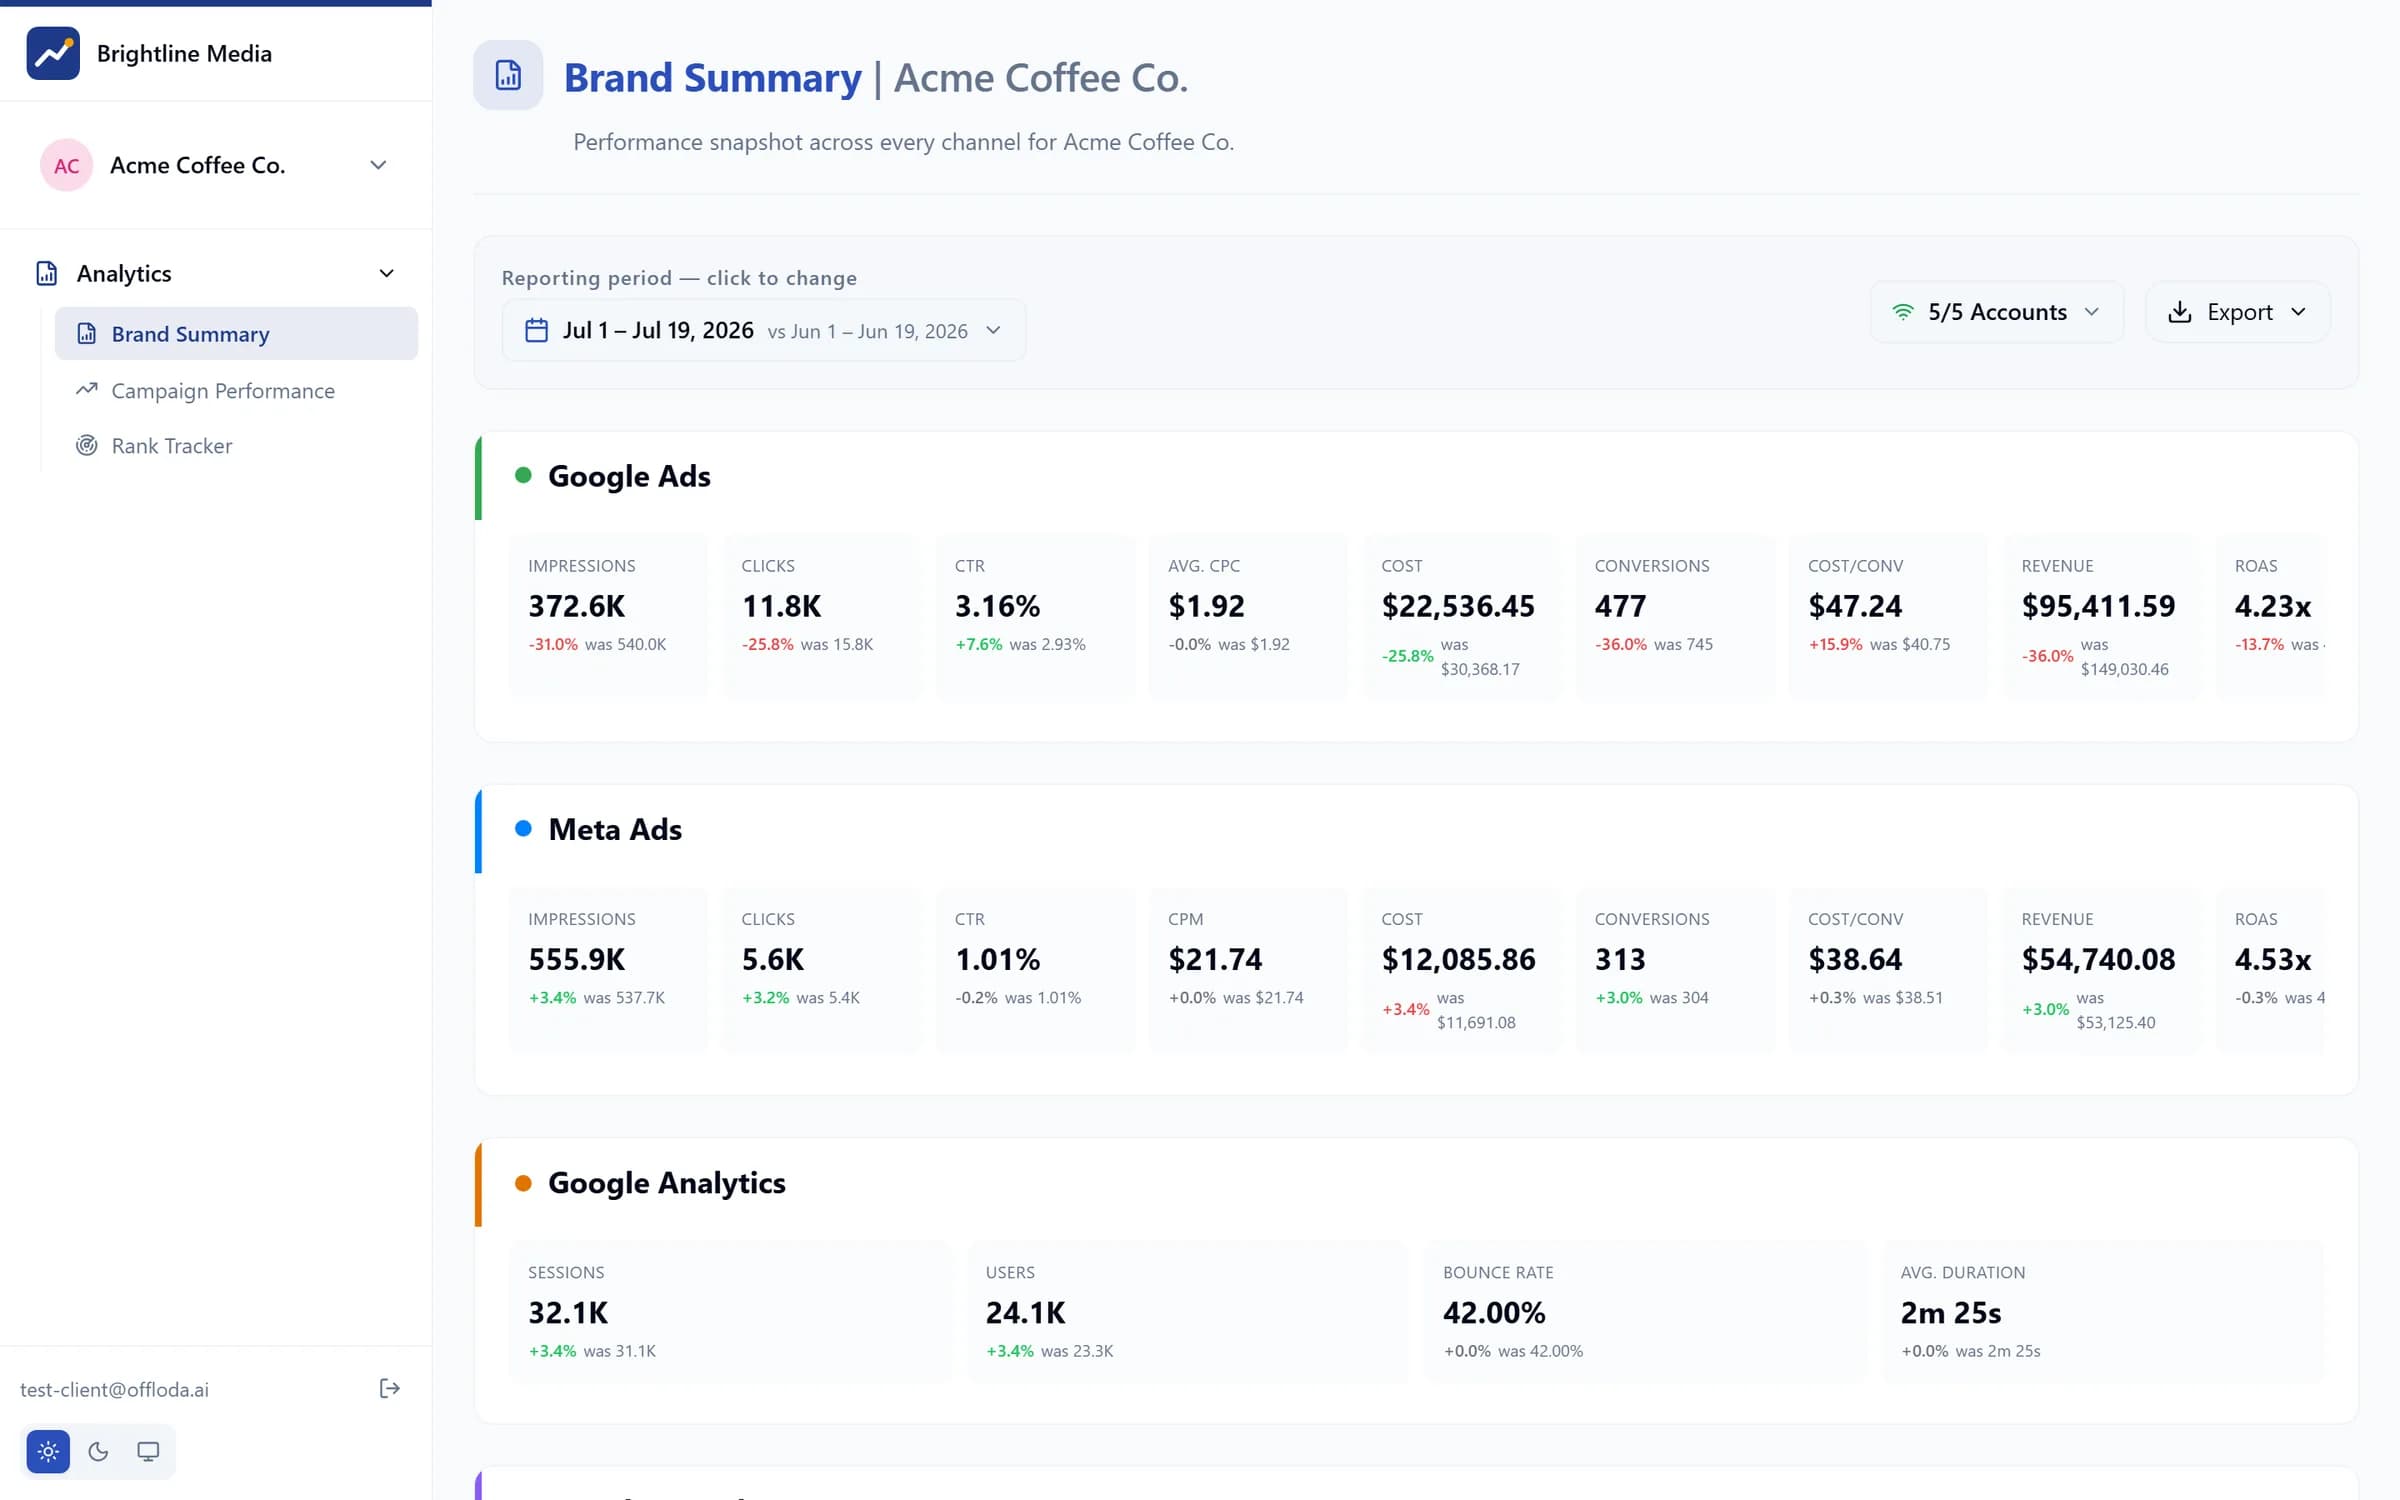
Brand Summary
The per-channel snapshot: KPIs and mini-trends for ads, organic, analytics and rankings — the 'how are we doing?' page.
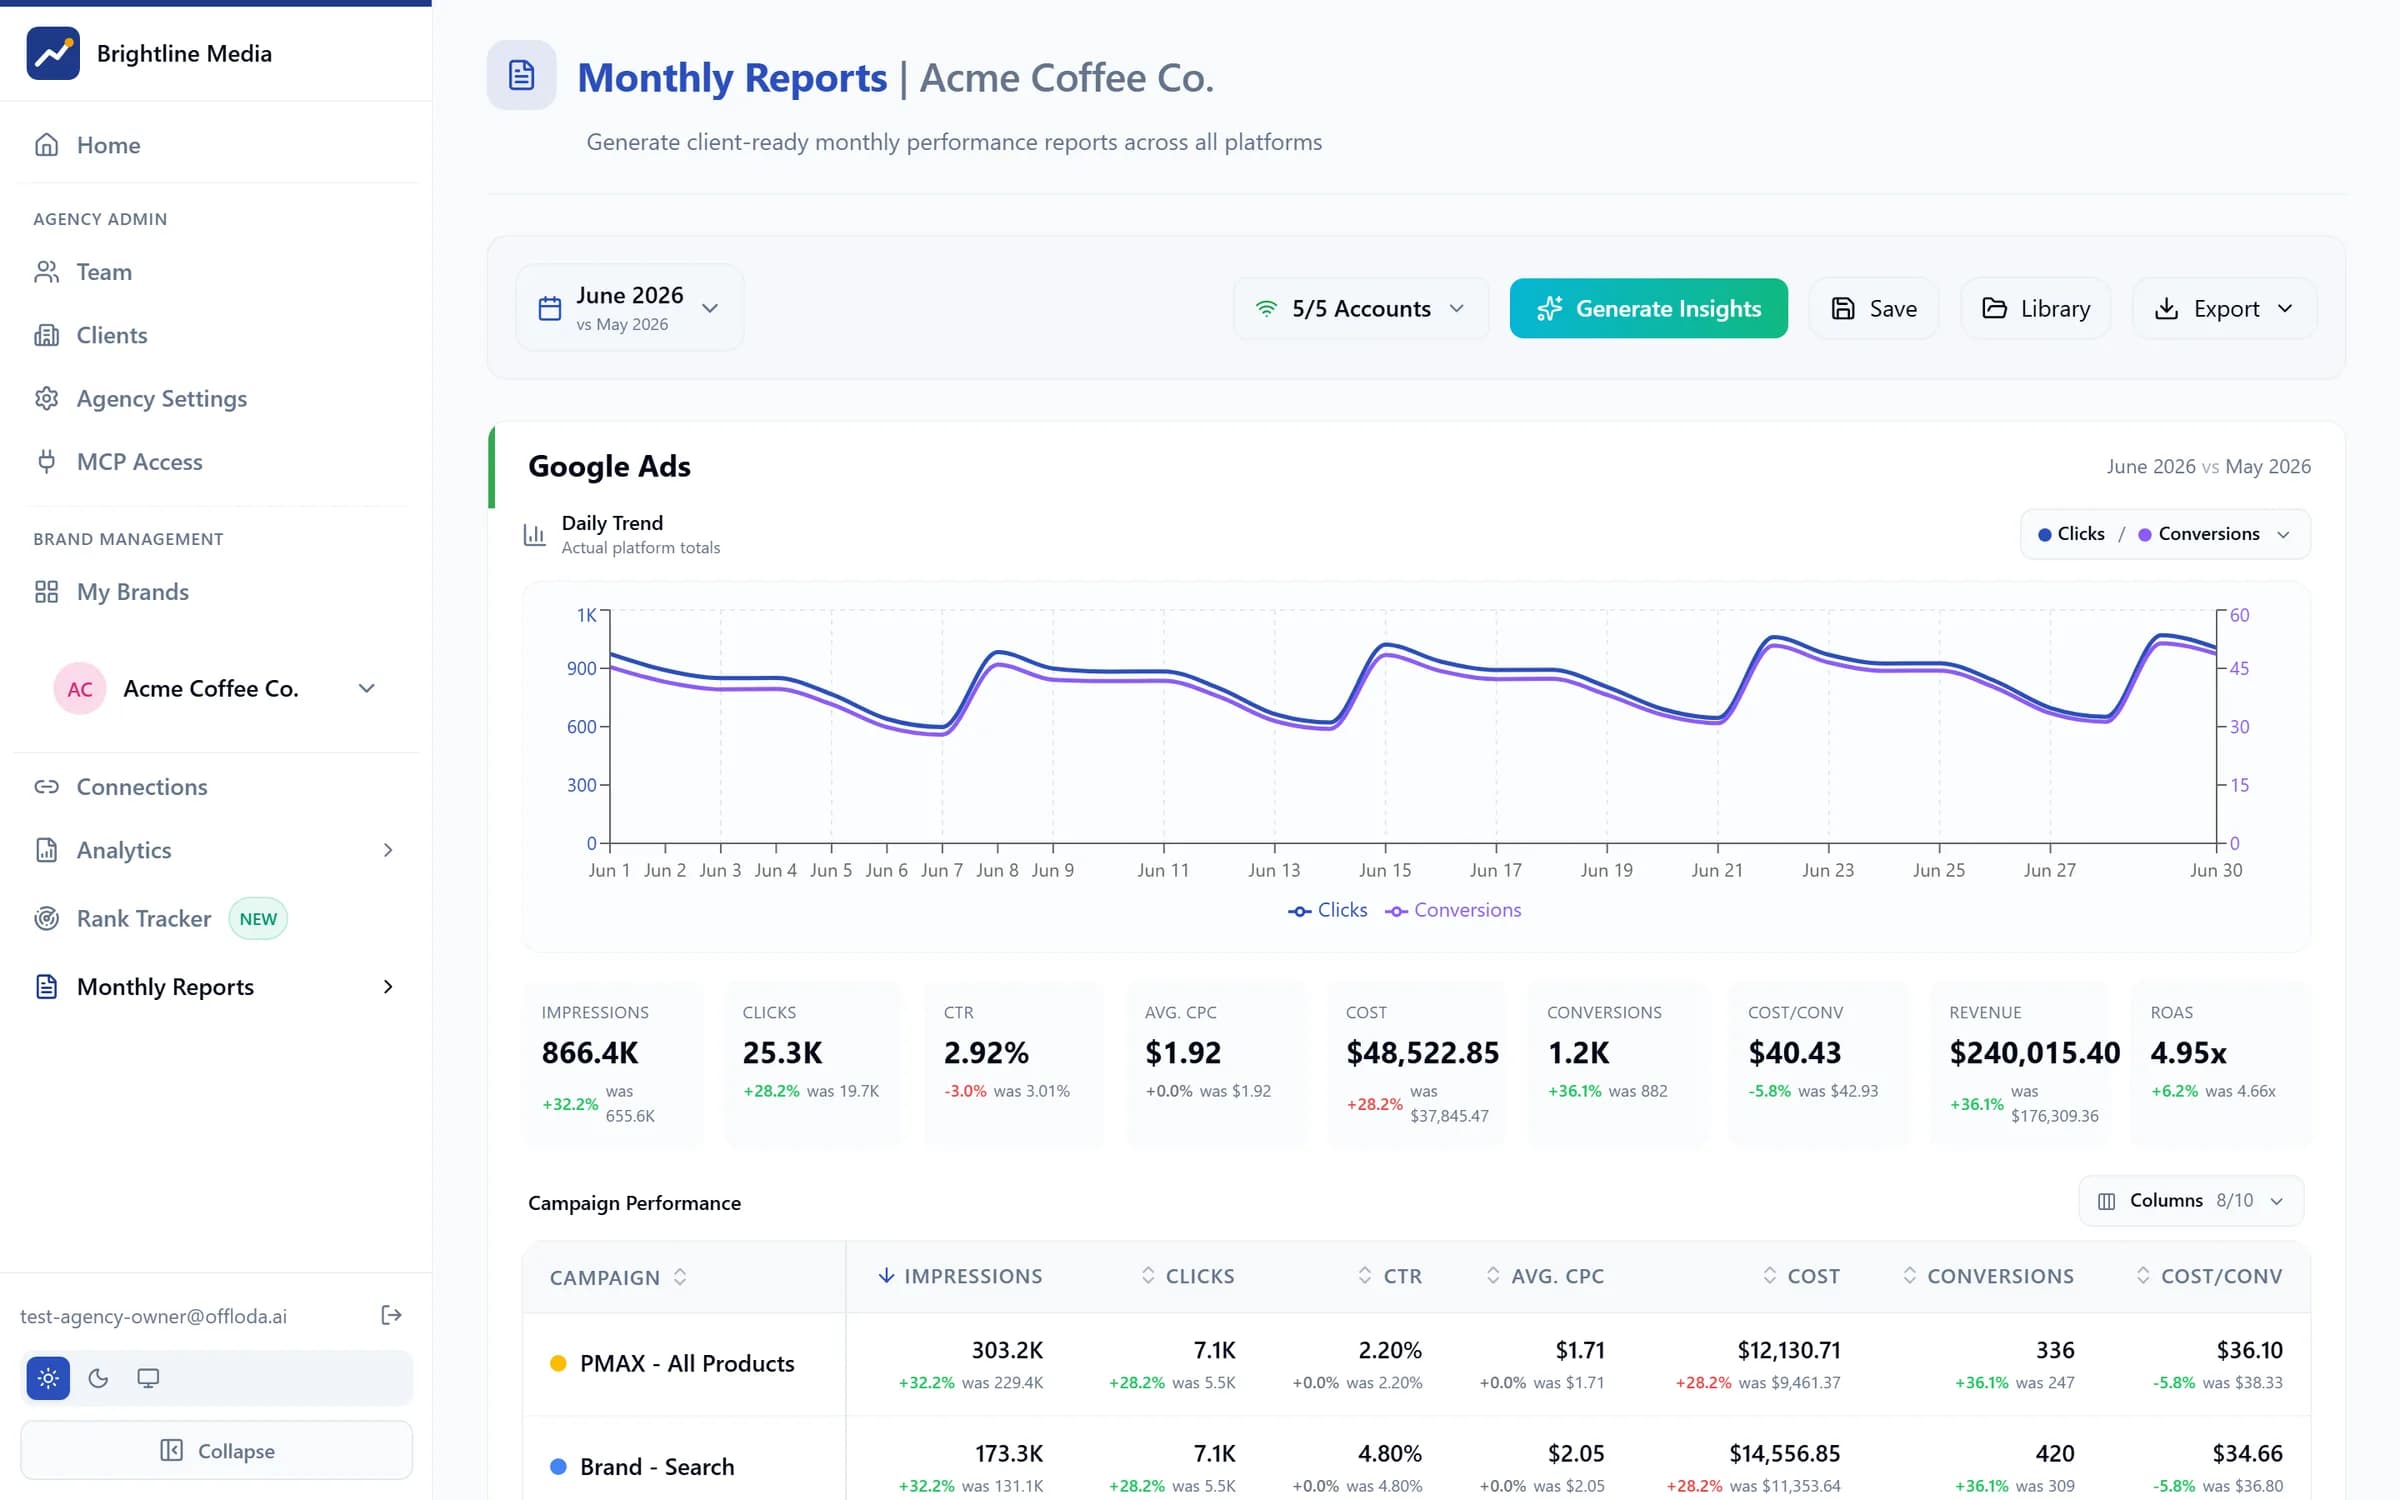
Monthly Reports
AI-written narratives from the live numbers, exported to branded PPT and PDF in seconds — not an afternoon.
The report writes itself. You approve it.
Monthly reports pull live from every connected platform, and the narrative — what happened, why, what's next — is drafted by AI from those numbers, tuned per brand. Your team reviews and ships; the export is styled with your logo and colours.
- AI-written summaries and recommendations per channel
- Branded PPT + PDF export in seconds
- Live data — never a stale CSV pipeline
A portal that answers before they ask.
Client seats get a read-only portal under your brand: the same summaries and dashboards, view-only, always current. 'How are we doing?' becomes a login, not an email thread.
- View-only client seats under your domain and brand
- Each client sees exactly their own data, nothing else
- Rankings, paid and organic in one place
The part they didn't expect.
“Wow. It's the first time I truly understand what is going on in our marketing campaigns with such detail.”
“I just cleared my weekly account checklist by 11am on Monday. I might have to find some new clients to stay busy.”
“I audited our site and fixed 3 issues on Search Console and Key Events missing in Google Analytics that I did not know were missing.”
Reporting questions
Does the AI just make the numbers up?
No — it can't. The narrative is written from the live figures pulled from each connected platform at the moment you generate the report; every number in the text is a number in the tables. What the AI adds is the explanation: what moved, why, and what to do next month. Your team reads it before it ships.
How long does a monthly report take?
Seconds to generate, minutes to review. Ask for last month on a brand and the narrative, the charts and the branded PPT and PDF come back together. The afternoon you used to spend assembling it goes into reading it — which is the part clients pay for.
Is it branded as my agency?
Yes, on every plan. Your logo, colours and name on the PPT and PDF exports, the dashboards and the client portal; the Offloda name appears nowhere your client looks. A custom domain is included too.
What does the client actually log in to?
A read-only portal under your brand. Client seats are $50 a month each and show the same summaries and campaign tables your team works from, view-only and always current. “How are we doing?” becomes a login instead of an email thread.
Which platforms show up in the report?
Whatever's connected to that brand: Google Ads, Meta Ads (pending approval), Google Analytics, Search Console, and the Google and AI-search rankings you track. Each channel gets its own section and its own numbers. If a platform isn't connected, it isn't in the report — nothing is estimated.
Reporting is the retainer. Deliver it in seconds.
See a monthly report generate live in the demo.